|
v1.1.0
|
|
v1.1.0
|
Tips for debugging your games
Unfortunately, it's inevitable - bugs will find their way into your game. Never fear! Let's go over some of the strategies available for hunting them down.
The simplest form of debugging available is LOG() and its friends in the Macros module. This allows you to render values in your application according to a given format string, similar to printf().
In simulation, the output from LOG() is written directly to the console.
You can redirect the output to a file by invoking siftulator with the --stdout option, as follows:
$ siftulator awesome-game.elf --stdout mylogfile.txt
On hardware, there's of course no console to write to. Instead, swiss listen can capture console output from the Sifteo Base over a USB connection.
To be as efficient as possible, the Base sends only the bare minimum of log info over the USB connection, then swiss is responsible for accessing your game's .elf and decoding the log info accordingly.
This means you must provide the same elf running on the Base to swiss listen, as follows:
$ swiss listen awesome-game.elf
Your LOG() statements will be rendered to the console, and should look the same as when printed by siftulator.
See the Device Management guide for more details on how to use swiss.
When a fault occurs while your app is running, the Sifteo Base stores an internal record describing details of the fault, and displays the dreaded Cat Monkey.
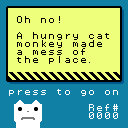
The Ref# in the fault display is not an error code, but an instance ID that allows you to distinguish a particular instance of an error from others that might be similar.
All the helpful details are stored internally in fault logs on the Base. Use the swiss savedata command, specifying com.sifteo.syslfs to retrieve the Base's internal savedata:
$ swiss savedata extract com.sifteo.syslfs my-fault-records.bin
Now, use the python script in the sdk/tools directory to interpret syslfs.bin:
$ python sdk/tools/savedata.py my-fault-records.bin
Sample output:
Fault Info for com.mycompany.mygame (0.3.0)
    uuid: f8531629-3539-42aa-8d54-b9b20e824292
Header Info
    reference: 2
    recordType: 1 - SVM Fault Record
    runningVolume: 0xb
    fault code: 0xe - User call to _SYS_abort
    uptime (in sys ticks): 30627379585
CubeInfo
    num connected to the system (bitmap): 0xf0000000
    num visible to user space (bitmap): 0xf0000000
    cube range: 3 - 8
Registers
    PC: 0x8000030e
    SP: 0x2000fab8
    FP: 0x2000fab8
    r0: 0x20003f40
    r1: 0x20002680
    r2: 0x3d0e5532
    r3: 0xffffffff
    r4: 0x00000000
    r5: 0x00000007
    r6: 0x21704fb2
    r7: 0x00000003
This shows us that com.mycompany.mygame, version 0.3.0, was responsible for generating fault code 0xe, which indicates a call to _SYS_abort(). This fault was Ref #2, so if this same fault had happened several times, we'd have a way to determine which is which.
In the Registers section above, PC is short for program counter, which is the register that holds the address of the instruction being executed at any given moment. We can cross reference the PC from the fault log with your game's .elf to see what was executing when the fault was generated.
To do this, you'll need to install the ARM GCC toolchain available at https://launchpad.net/gcc-arm-embedded. Once this is installed, you can run a command like the following:
$ arm-none-eabi-objdump -d awesome-game.elf | arm-none-eabi-c++filt -n | less
You'll be presented with the disassembly of your game, with the addresses in the column on the left, and function names interleaved to indicate where they begin. Scroll through the output until you find the PC address, and you should have your culprit!
less may not be available by default, but can be installed via http://www.mingw.org. Future SDKs will likely have a more streamlined approach for this process.We have plans to introduce GDB-compatible source level debugging in a future release, but this is not yet available. Stand by!
Sifteo SDK v1.1.0 (see all versions)
Last updated Tue Dec 23 2014, by Doxygen

